

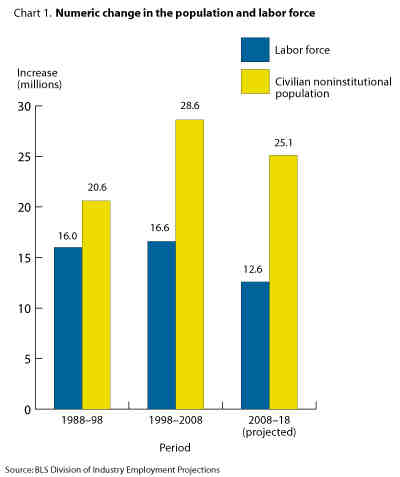
GRAPH SIX Fewer American jobs as both products, services and employment moves offshore. How do we pay off such debt while shedding jobs? If our economy grows at 1% and our debt at 6% per year, how does society pay its hospital bill if it wants first rate medical care? Yellow bar represents everyone not institutionalized for crime, nursing homes, military and the like. Go here for a complete understanding of the yellow bar. http://www.dlt.ri.gov/lmi/pdf/lfconcepts.pdf The net effect according to this graph is a net slowing of growth in this country until 2018. The number of jobs is going to decrease in relation to those not working To see this graph and others like it. go to the below link. http://www.bls.gov/oco/oco2003.htm#Labor%20Force


