

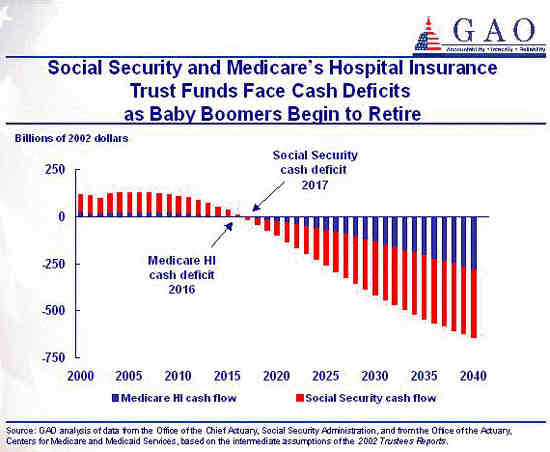
GRAPH NINE GAO (GOVERNMENT ACCOUNTING OFFICE) figures about the economic implications. The GAO is very conservative in their estimates. This graph is included so that the reader can understand this information is coming from more than one source inside government.


